Bandura · API testing IDE
v1.0.0-rc.9 is out now on macOS, Windows and Linux. macOS builds are unsigned early access.
See where your API test breaks.
Trace login, token capture and dependent requests on one visual graph. Inspect the failing step, fix it, and run the same test in CI. Your files stay in your Git repo.
Free for personal and commercial use. No account. No trial.
- Works fully offline
Edit, run, import, debug. No network, no account, no sign-in wall.
- Plain text, in your Git repo
.aetherYAML you can diff, review, and blame. No export step, no lock-in. - No account, no telemetry
Tests, tokens, and run history stay local; the only two destinations the app reaches on its own behalf are the AI provider you choose and GitHub, for a switchable once-a-day update check. The complete list.
- Free for work, too
No paid seat, trial countdown or activation key.
Import and build
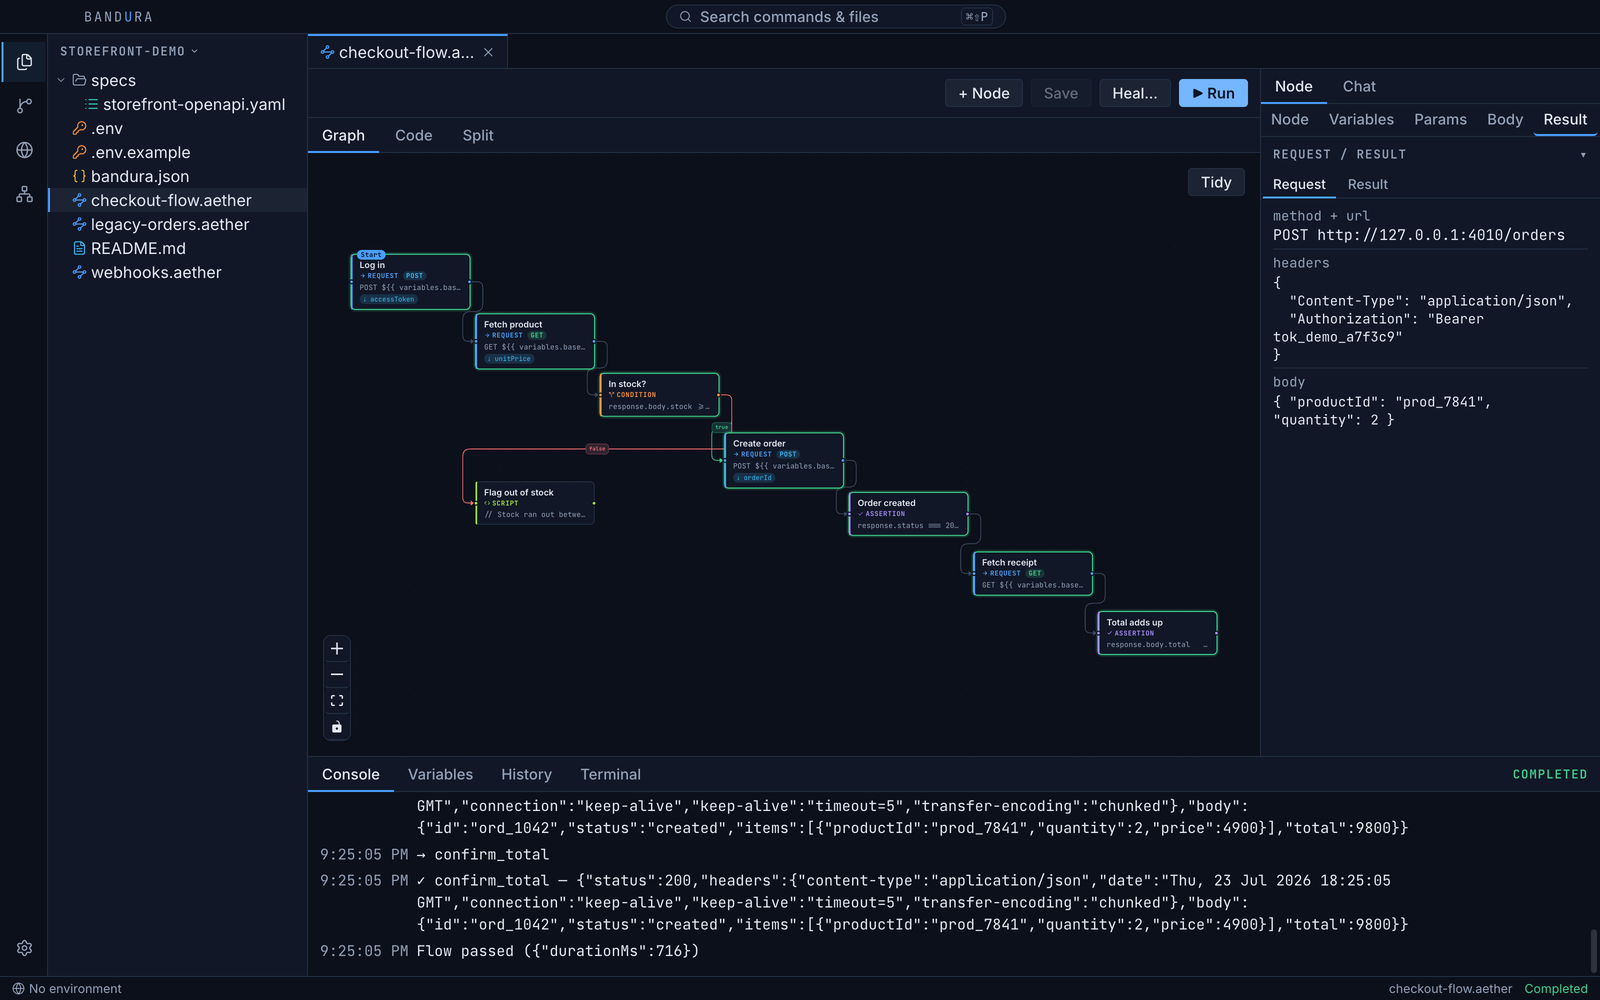
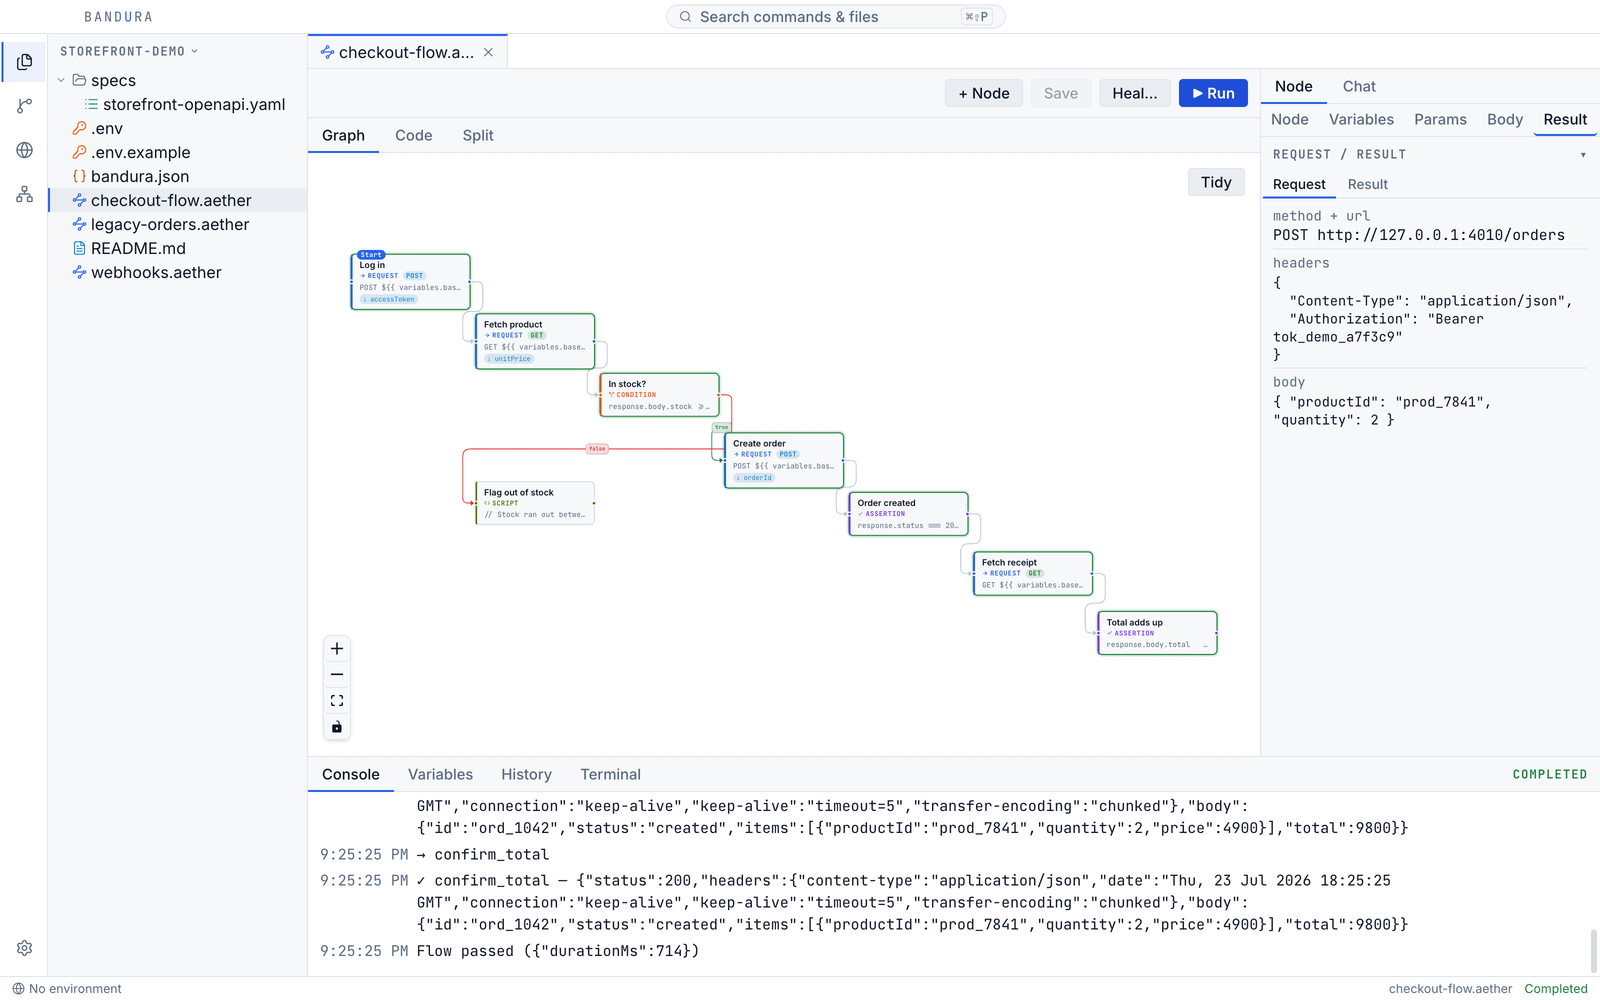
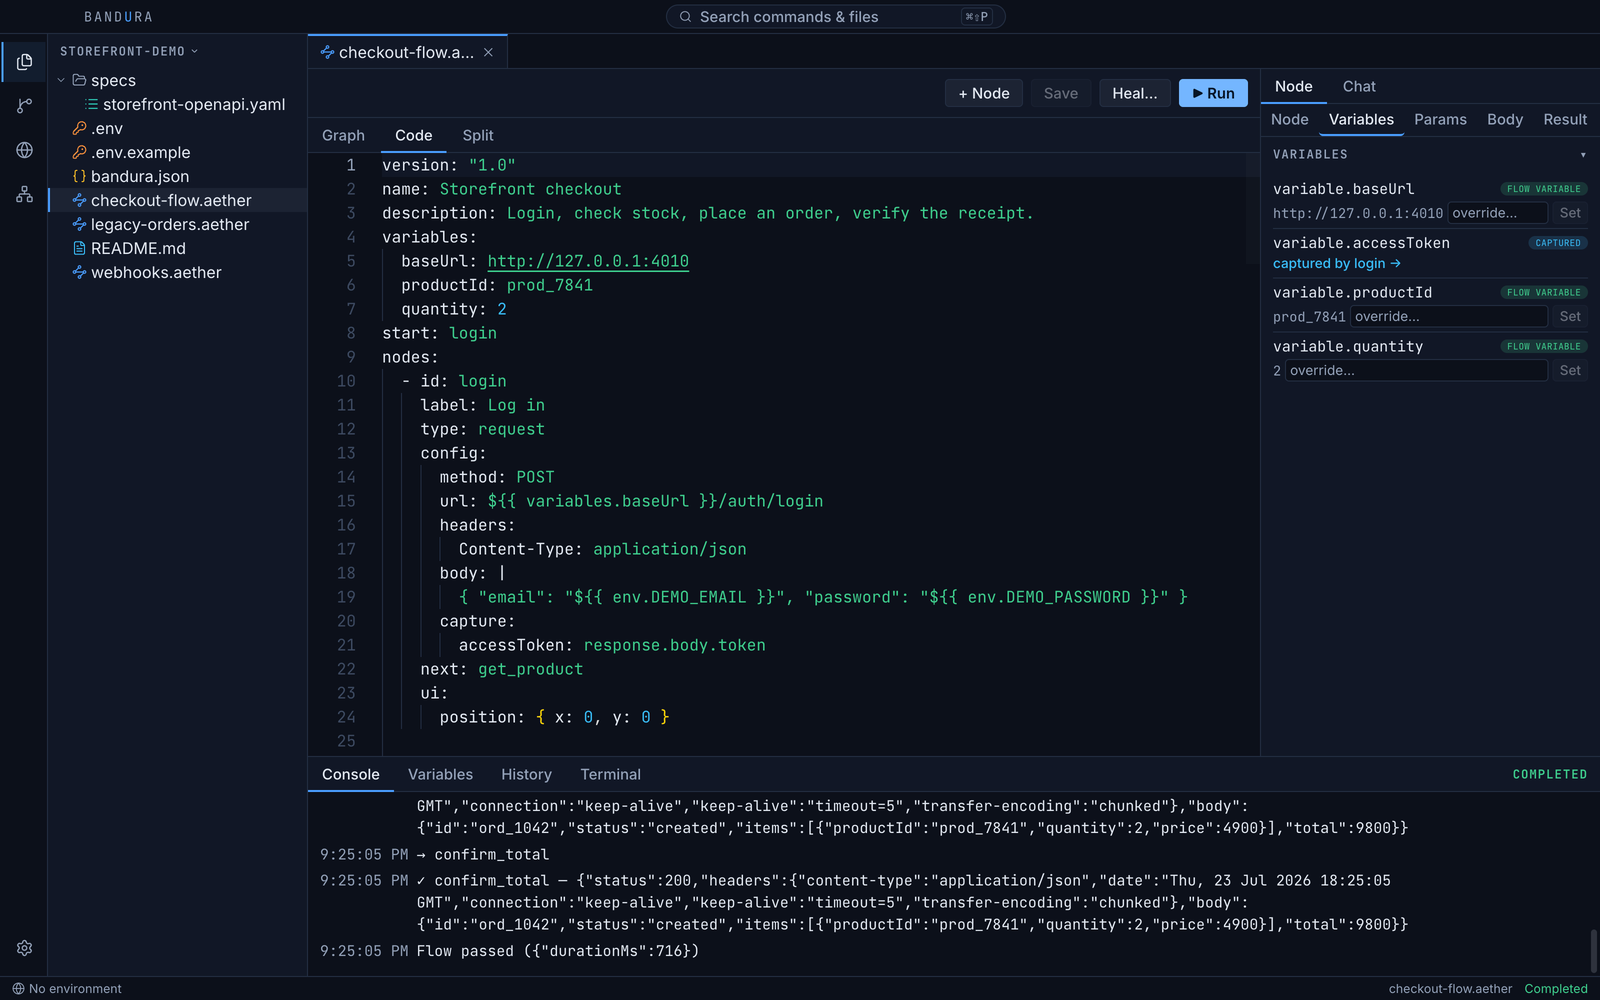
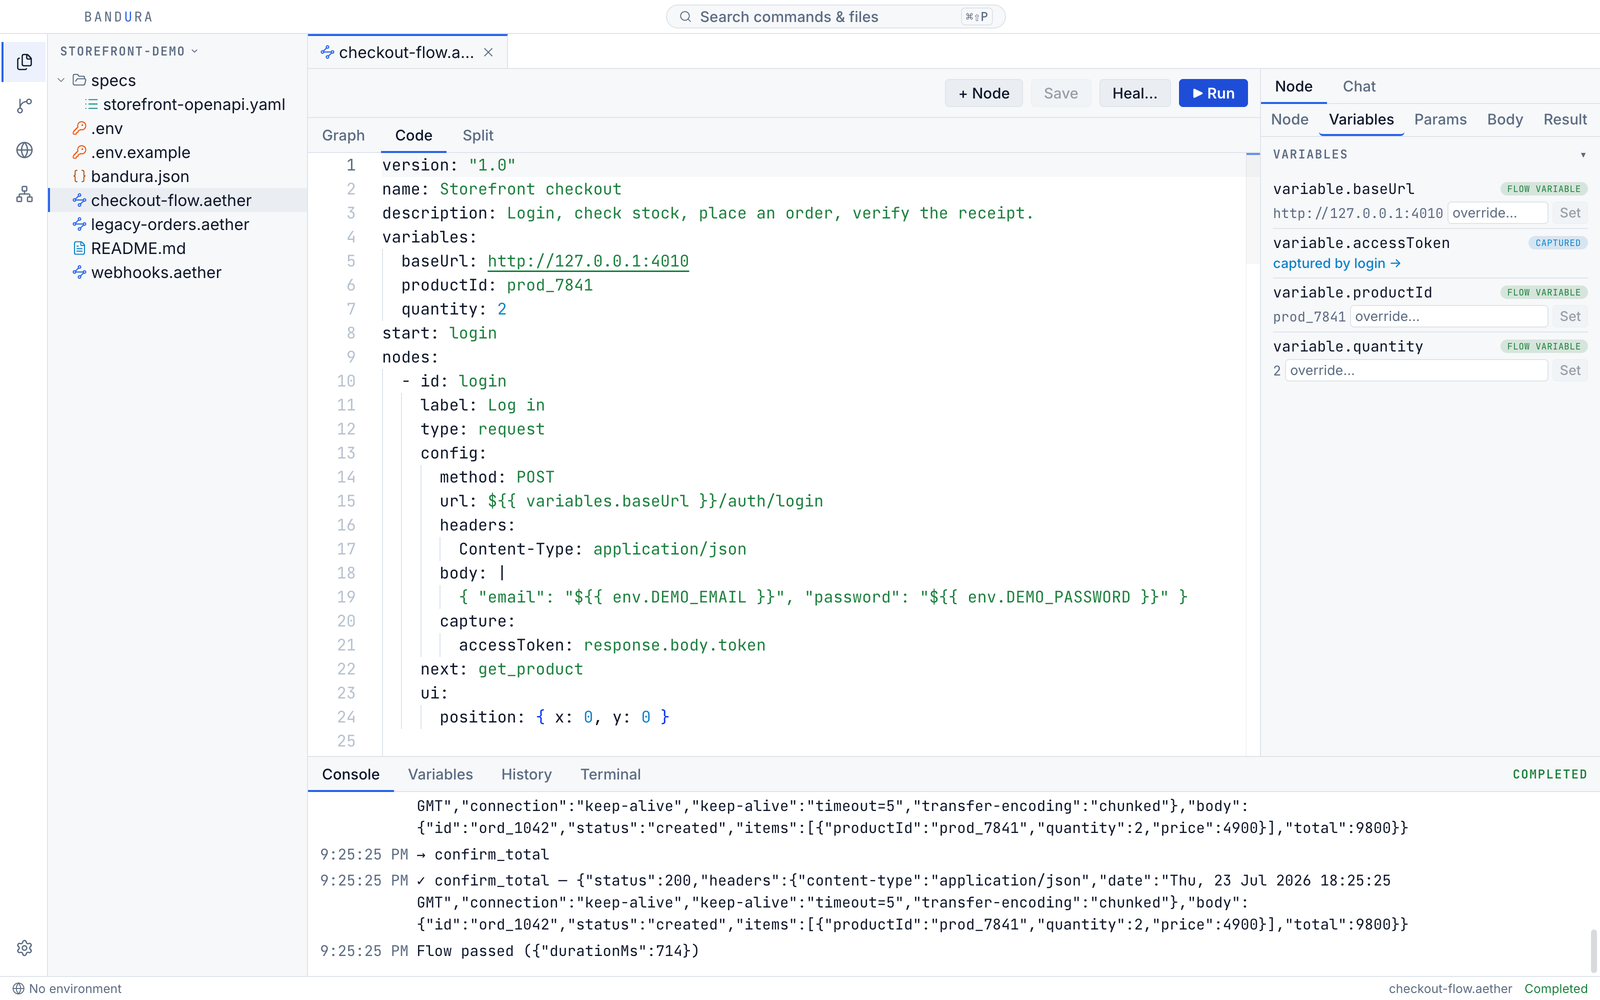
Not an export. Not a sync. Two renderings of one file.
Postman Flows hides the code. Bruno has no graph. Here both views are the same
.aether YAML, so there is nothing to keep in sync.
- id: login
  type: request
  config:
    method: POST
    url: ${{ variables.baseUrl }}/auth/login
    body: |
      { "email": "${{ env.DEMO_EMAIL }}", "password": "${{ env.DEMO_PASSWORD }}" }
    capture:
      accessToken: response.body.token   # every later node can read this
  next: get_product
Plain YAML with embedded JavaScript: diffable, and readable by any AI assistant.
Run and inspect
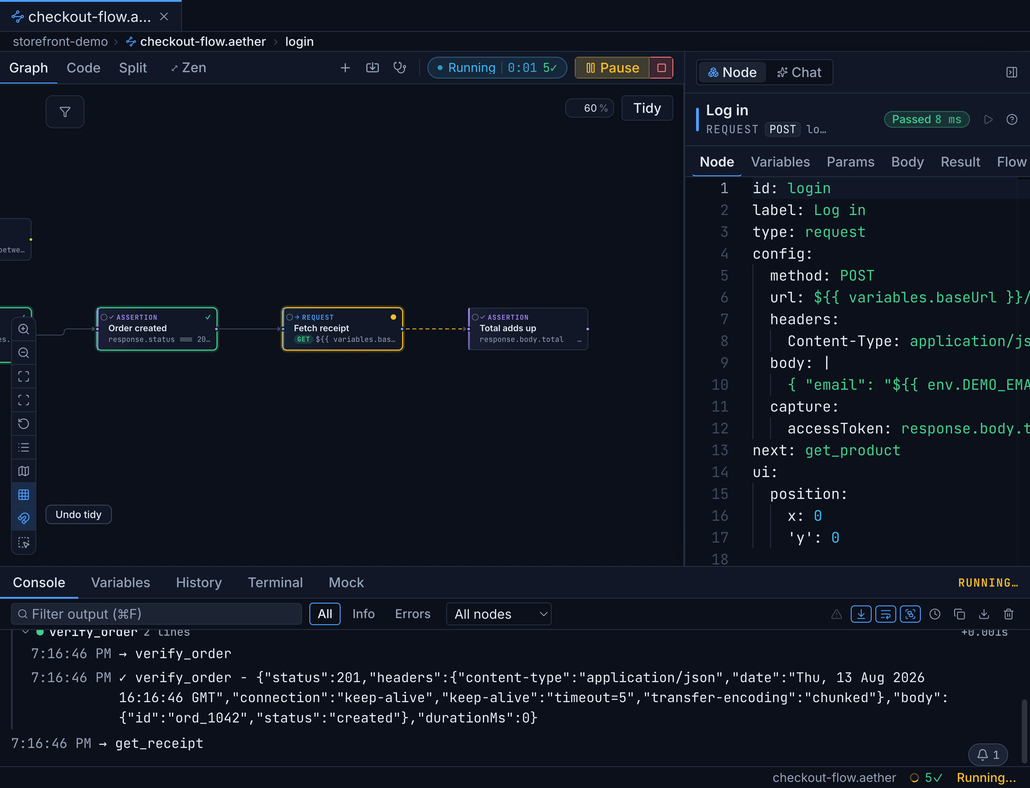
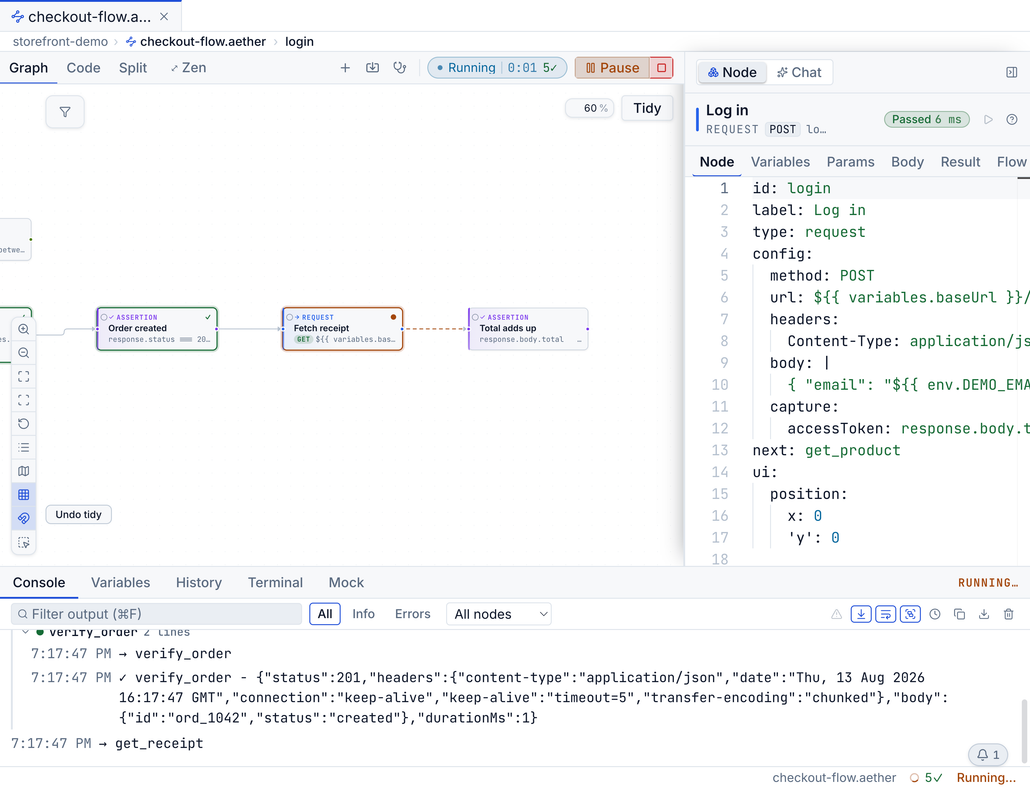
Watch it run. Then ask any node what actually happened.
A run lights the graph node by node. Click any node for its resolved request and response: not the template, the real thing that went over the wire.
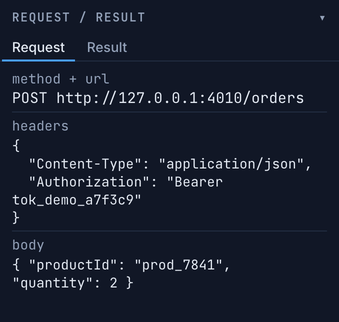


Unresolved references get a ⚠ before the run, not a silent
undefined three nodes deep.
Commit and share
Sharing a test suite is git clone.
No workspace invite, no export. A Bandura project is a folder of plain-text files, so it was already in your repo. Your teammate clones it and runs.
-
git clone … && open the folderRecognized from
bandura.json. Nothing to convert. -
fill in the two env vars it asks forThe manifest declares variable names, never values. Secrets stay in a git-ignored
.envor the OS keychain. -
▶ RunUnder a minute from clone to a green graph.
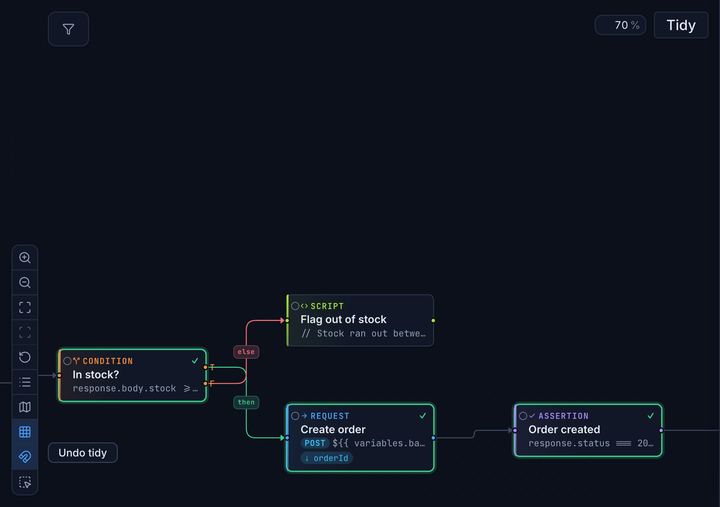
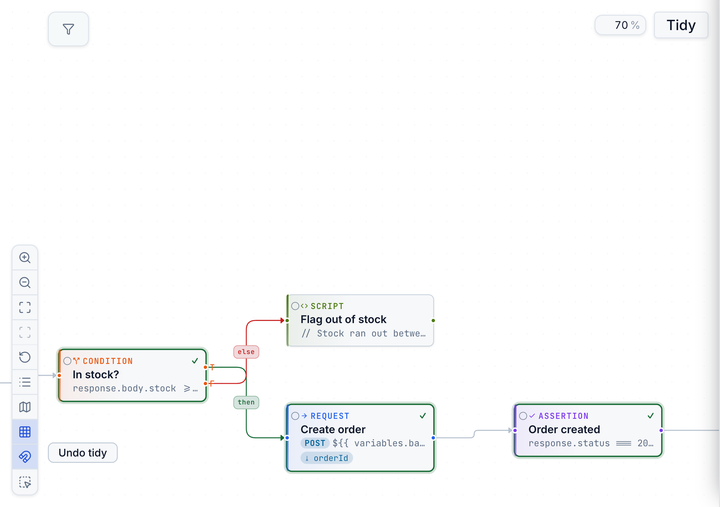
Review API tests like code, because they are code
- id: create_order
type: request
config:
method: POST
- url: ${{ variables.baseUrl }}/order
+ url: ${{ variables.baseUrl }}/orders
capture:
+ orderId: response.body.idA test change in a pull request: reviewable, blameable, revertable. Try that with a database-backed collection. More on Git-native API testing →
Automate in CI
The same engine runs everywhere the work happens.
The desktop app, the CLI, and the MCP server share one execution engine. What passes on your machine passes in CI: same code, same file.
On npm now
# Installs a self-contained native binary. No runtime to load.
npm install -g @bandura/cli
bandura --version

# ...or run without installing
npx @bandura/cli run
A native binary per platform: macOS, Linux (glibc & musl), Windows. No account, no backend, and the CLI also runs on macOS without the desktop app. Read the CLI reference →
Exit 0 on green, non-zero on any failure: the CI contract. Reporters: pretty, JSON, JUnit XML, GitHub annotations. Run a file, a glob, or a named collection.
# .github/workflows/api-tests.yml (generated by "Export to CI/CD")
- run: npx @bandura/cli run "flows/**/*.aether" --reporter github
  env:
    BASE_URL: ${{ secrets.STAGING_URL }}
That block runs today: @bandura/cli is on npm and the in-app
"Export to CI/CD" writes the file for you. A composite
bandura-io/run@v1 Action shortens it to three lines and publishes at
launch; until it is on the Marketplace we print the version that works. Secrets arrive
as environment variables. The full setup:
API tests in CI →
Optional AI
Start with your API. Add AI if it helps.
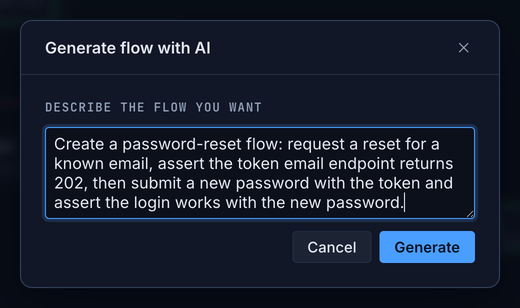
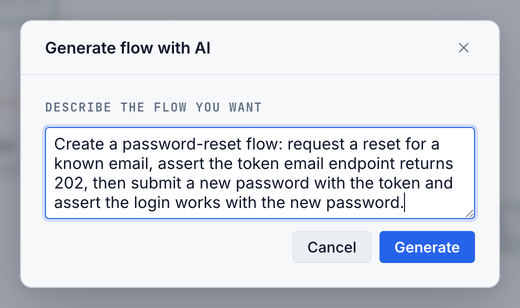
Build, run and debug flows without a model or API key. If you want help drafting a flow, connect your own provider or use a local model with Ollama or LM Studio. See local model setup →
Your agent can run the whole loop
The MCP server exposes your workspace to Claude Code, Claude Desktop, or Cursor: an agent runs a flow, reads the failing node's request and response, edits the YAML, re-runs. It runs where your files are, as a local stdio process, not a vendor cloud relay, so your flows, tokens, and responses never transit anyone's servers. Details: the MCP server →
macOS or Windows or Linux? It is live.
v1.0.0-rc.9 is available now. Try a sample flow, then run it against your own API.
The rest of the workbench
The parts you only miss when they are gone.
Building the flow
Data-driven runs
Attach a CSV or JSON dataset and the flow runs once per row, that row in scope as
data, each row an independent test case.
Typing never blanks the canvas
Half-written YAML doesn't parse, which is normal rather than broken. The last graph that parsed stays on screen, dimmed and marked stale, with editing paused until the file is valid again.
Talking to real APIs
Auth you declare, not assemble
An auth block on a node or the whole flow: basic, bearer, API key,
OAuth2, AWS SigV4. OAuth2 fetches the token once per run and refreshes it before it
expires, so ten requests make one token call. SigV4 signs the request that actually
ships, and re-signs on every retry.
Cookies just work
Set-Cookie is captured and replayed by domain, path and expiry, so
log-in-then-use-the-session is two nodes with no Cookie header
anywhere. An explicit header still wins, and one flag opts a request out.
Watching it run
Step through it like code
Set a breakpoint on a node, run, and the flow stops there with every captured
variable in scope. Step to the next node, run just one, or resume. Breakpoints live
in the app, never in the .aether file, so debugging state never lands
in a diff.
Run history
Every execution persisted locally in SQLite: durations, per-node results, what changed between runs. It never leaves your machine.
Fitting your setup
- Copy any request as code
-
cURL, JavaScript
fetch, Node axios, Python requests, Go, HTTPie. Generated from the request that actually went out, variables already substituted, so what you paste is what ran. - Plays well with other editors
-
Edit in VS Code or pull from Git and Bandura notices: clean files reload silently, dirty ones ask. It's your file, not the app's.
From the current build
Screenshots of the app as it is today.
Captured from the real desktop app, the same build the end-to-end suite runs against. No mockups, no repaints.
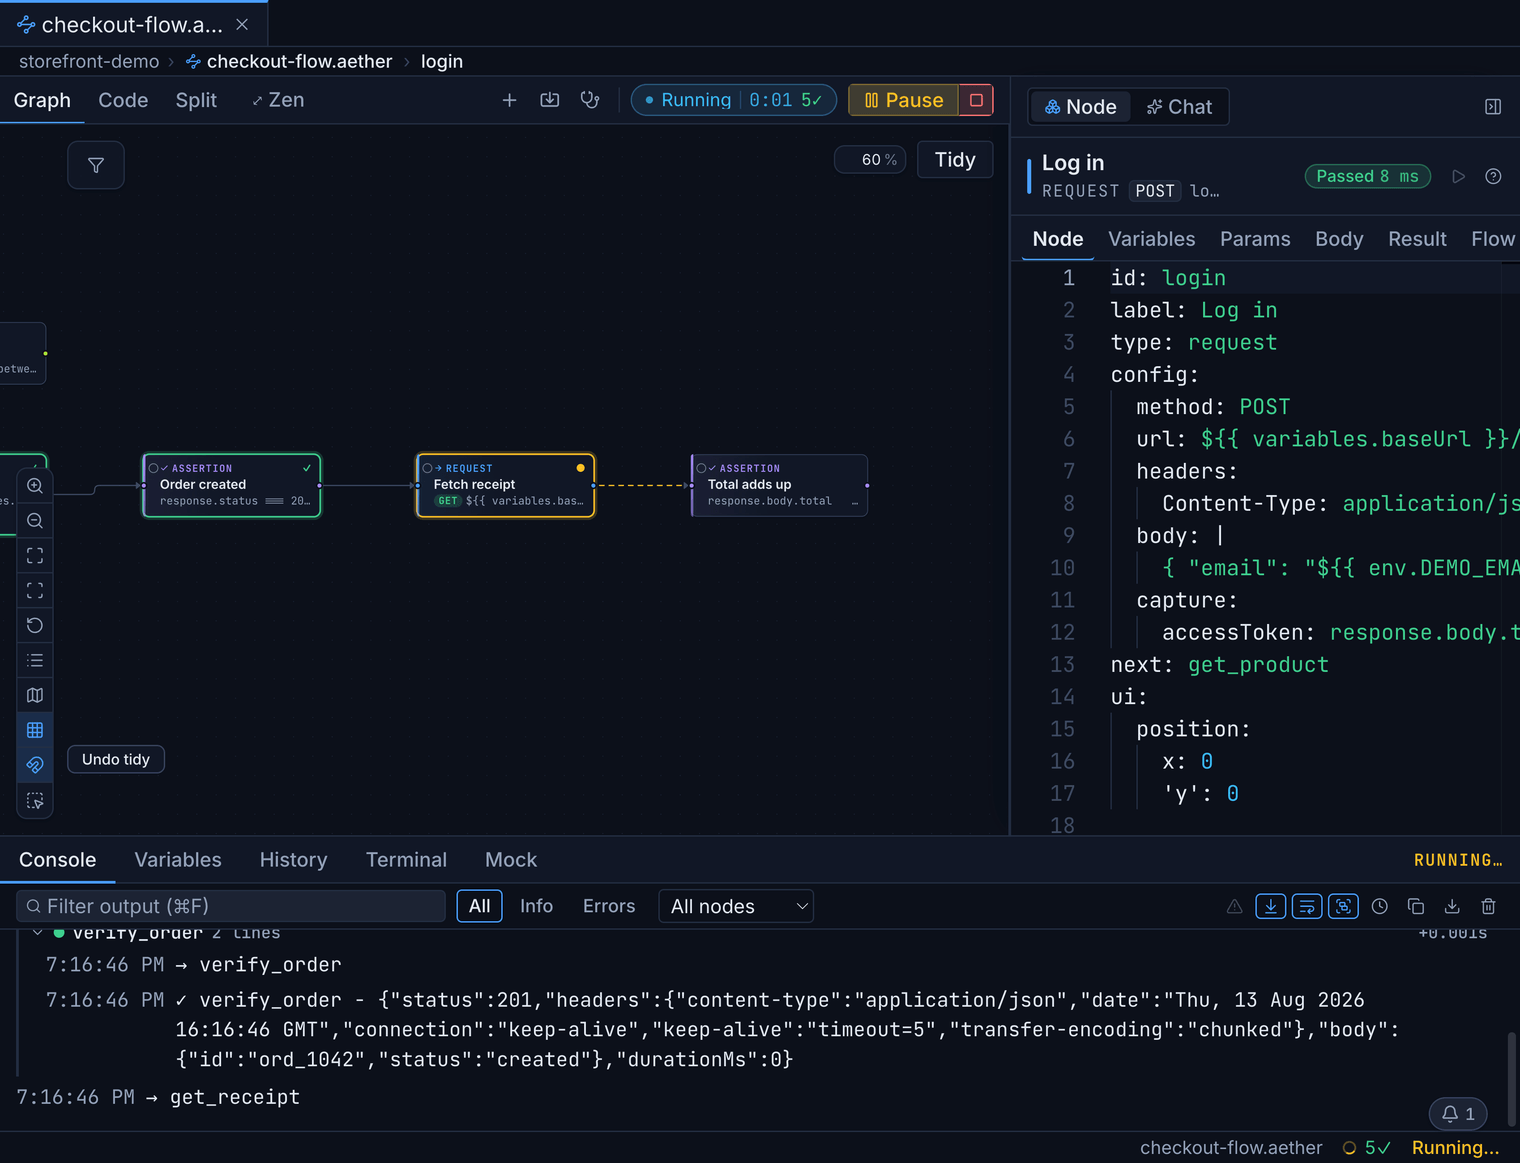
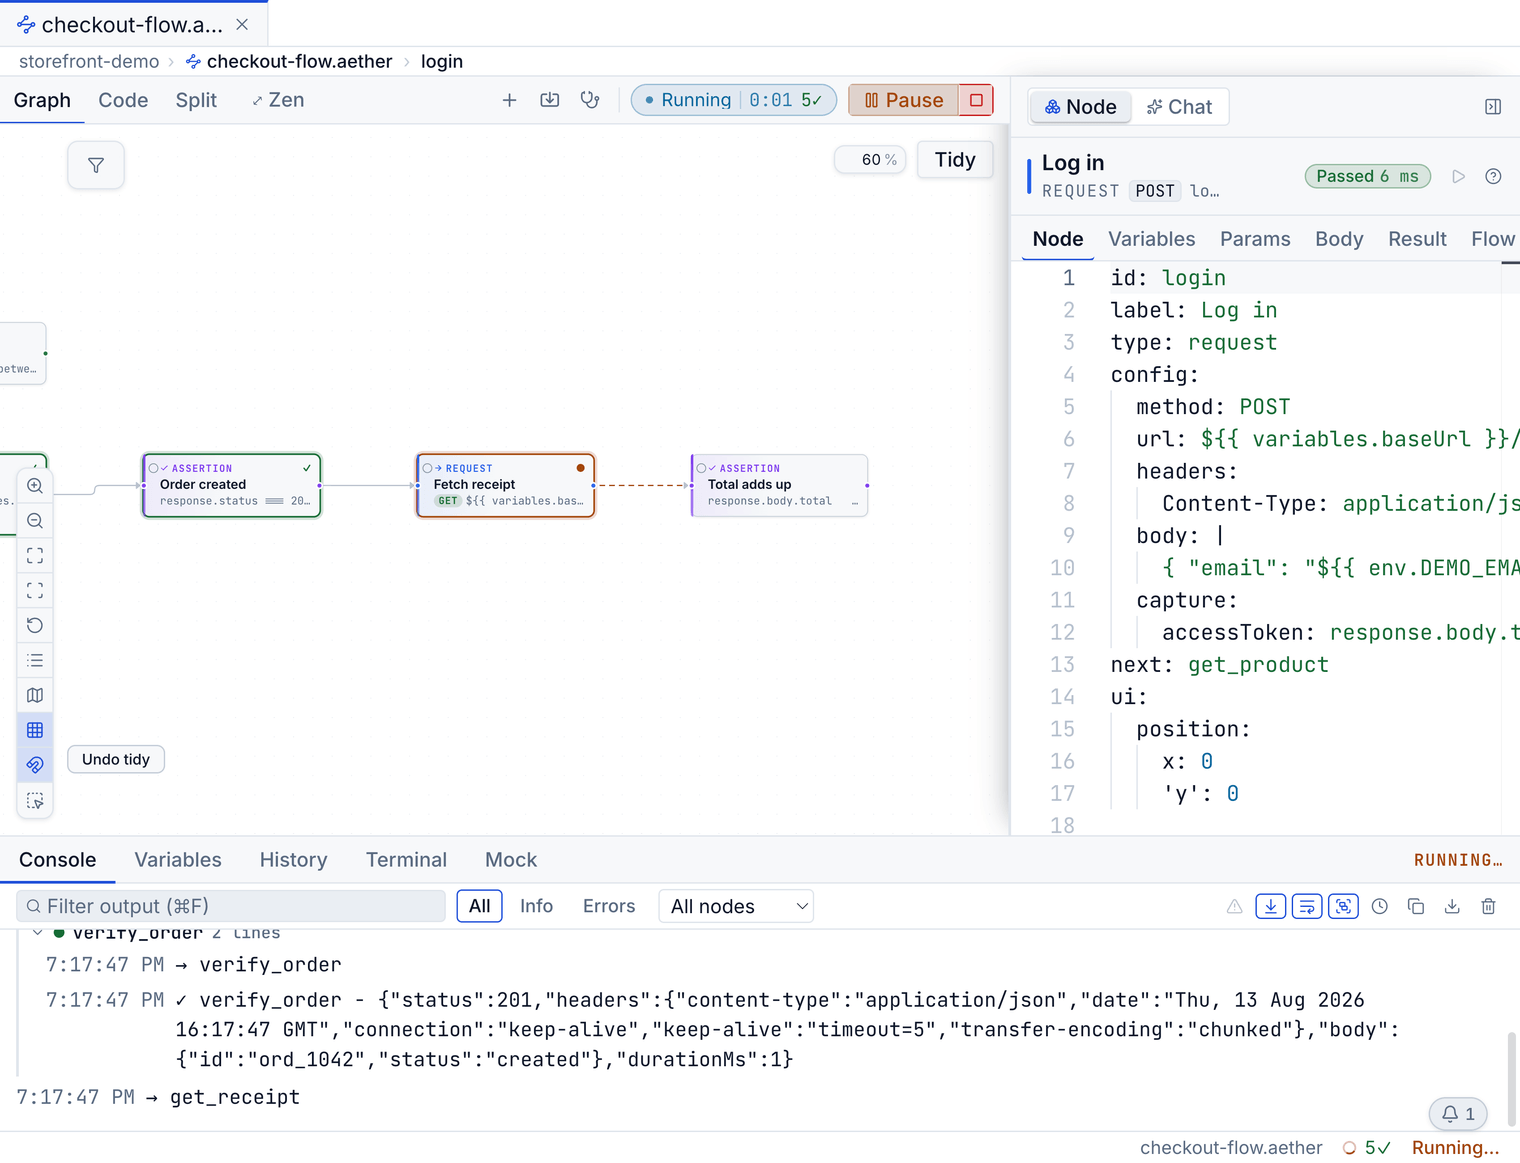
Graph editor
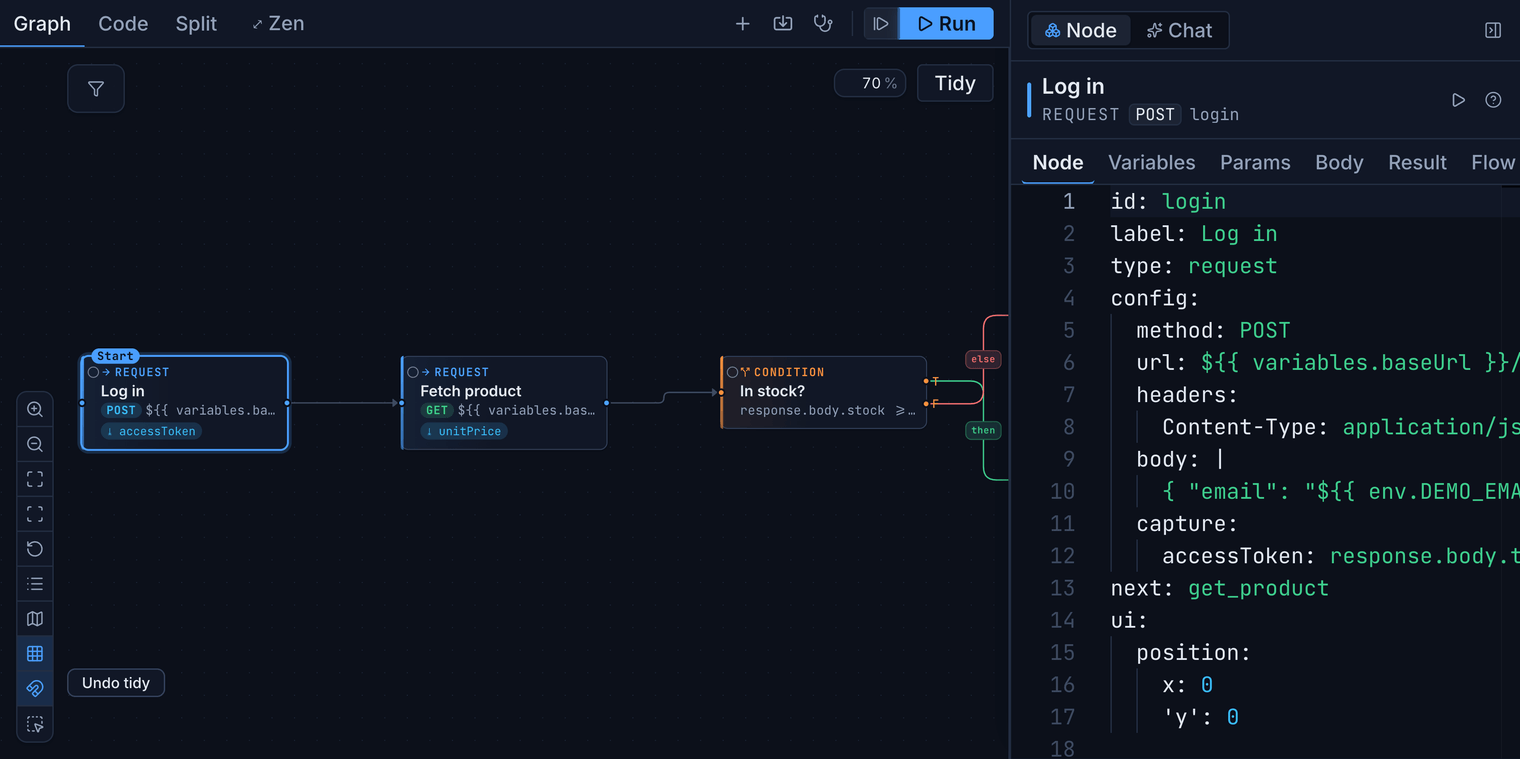
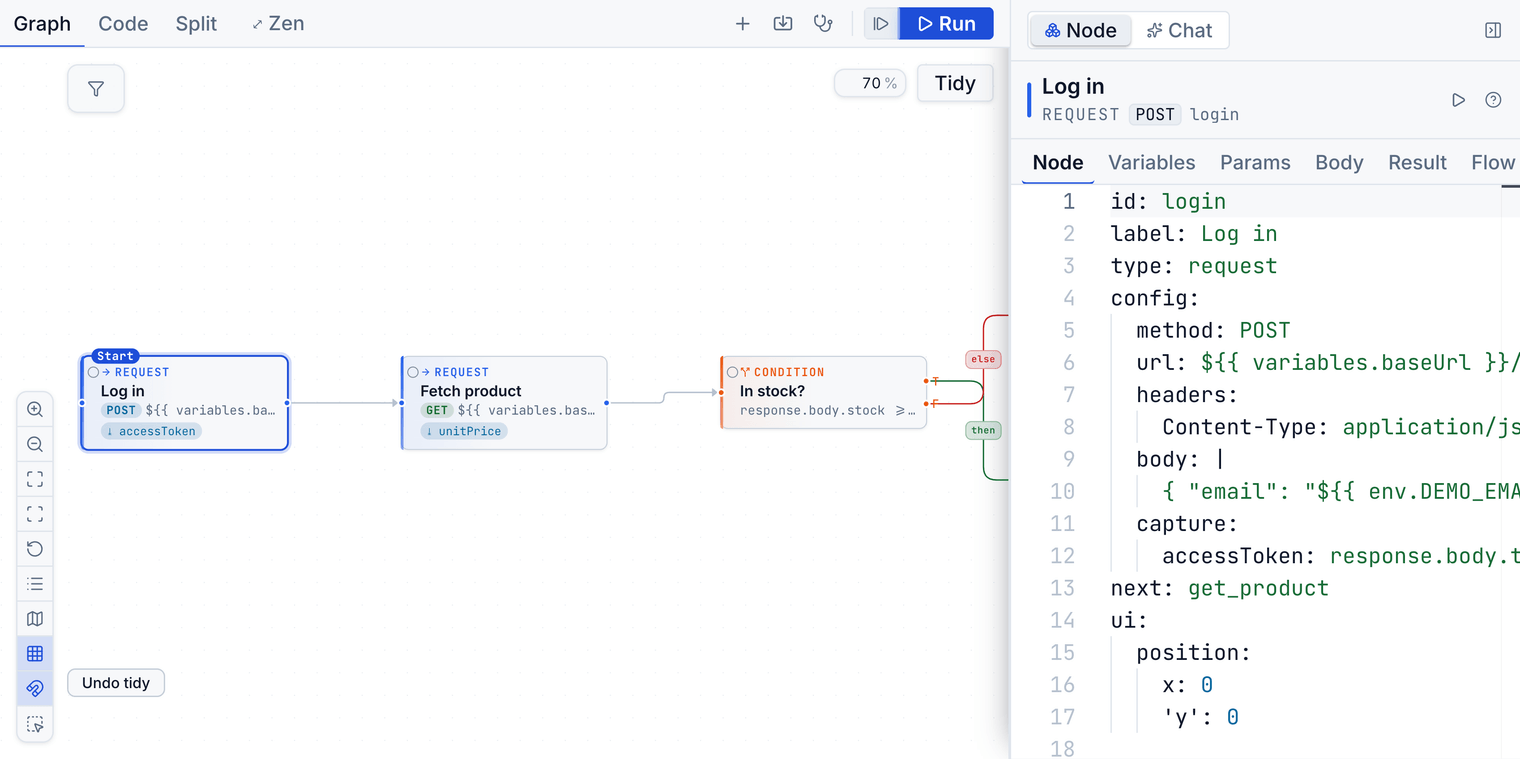
Model the scenario the way you'd whiteboard it.
Login, capture the token, spend it downstream. The graph is the test. Every node in it is still real, editable code underneath.
Execution
Runs you can watch, then interrogate.
Nodes light up as they pass or fail, and any one of them will show you the exact request and response it produced.
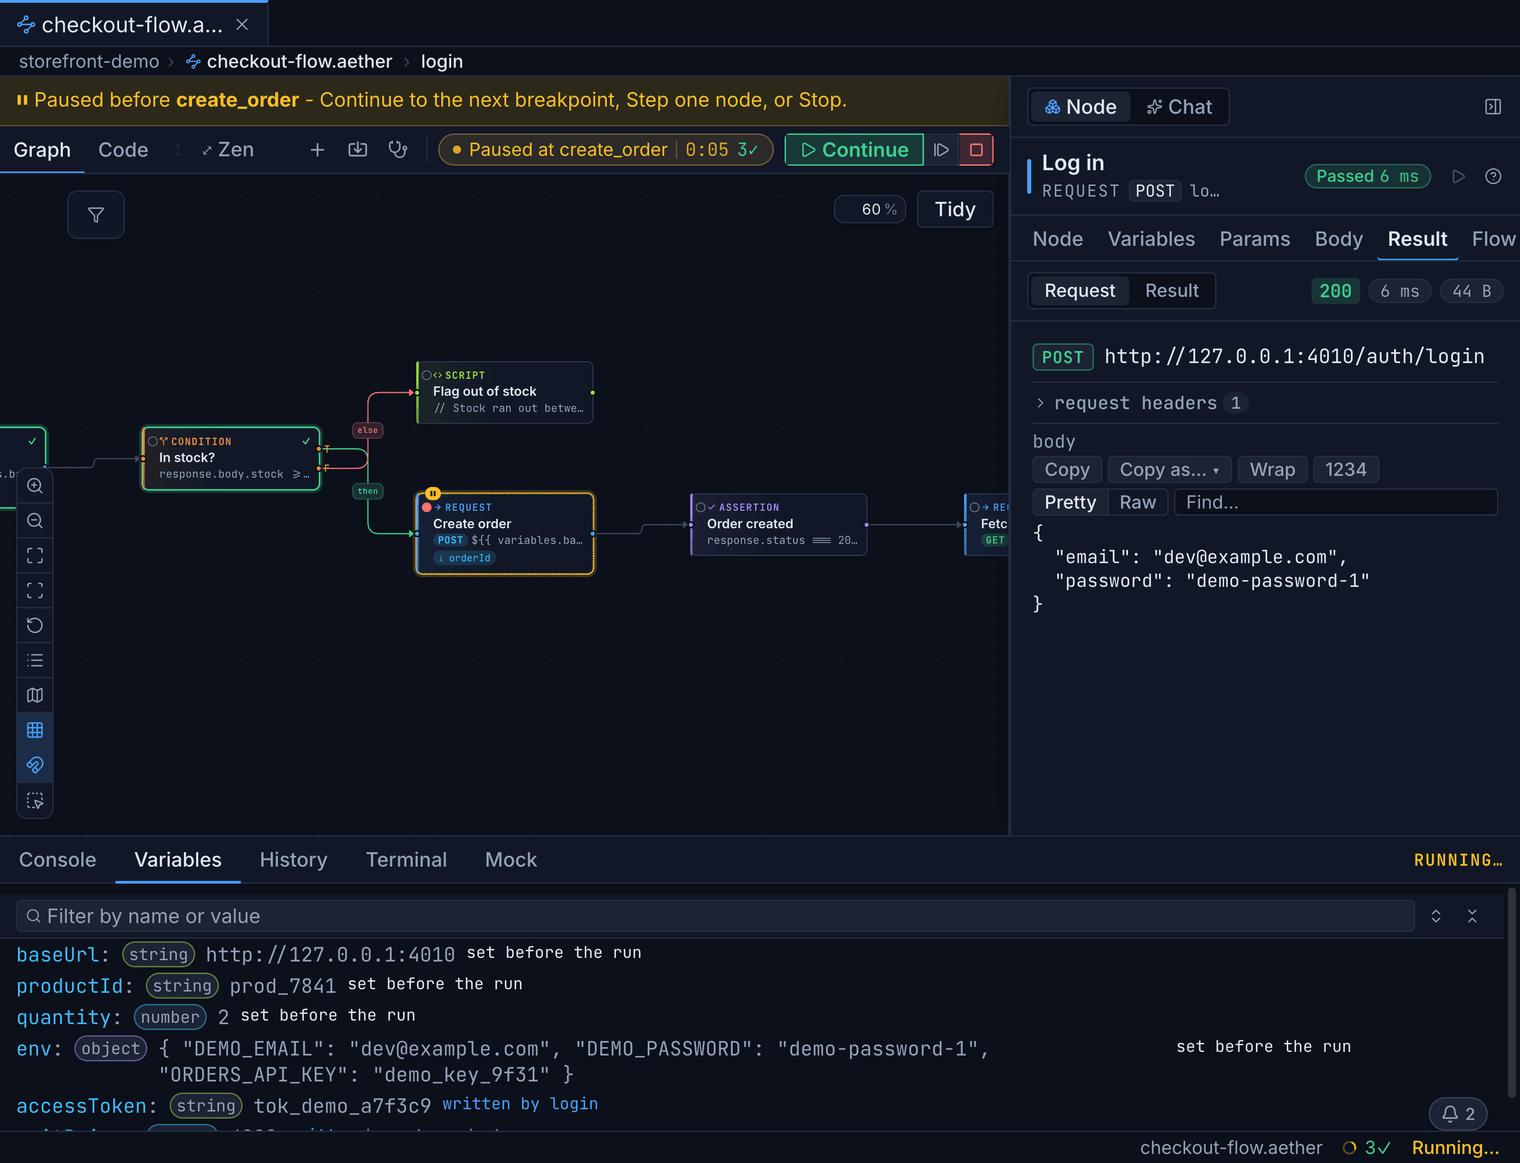
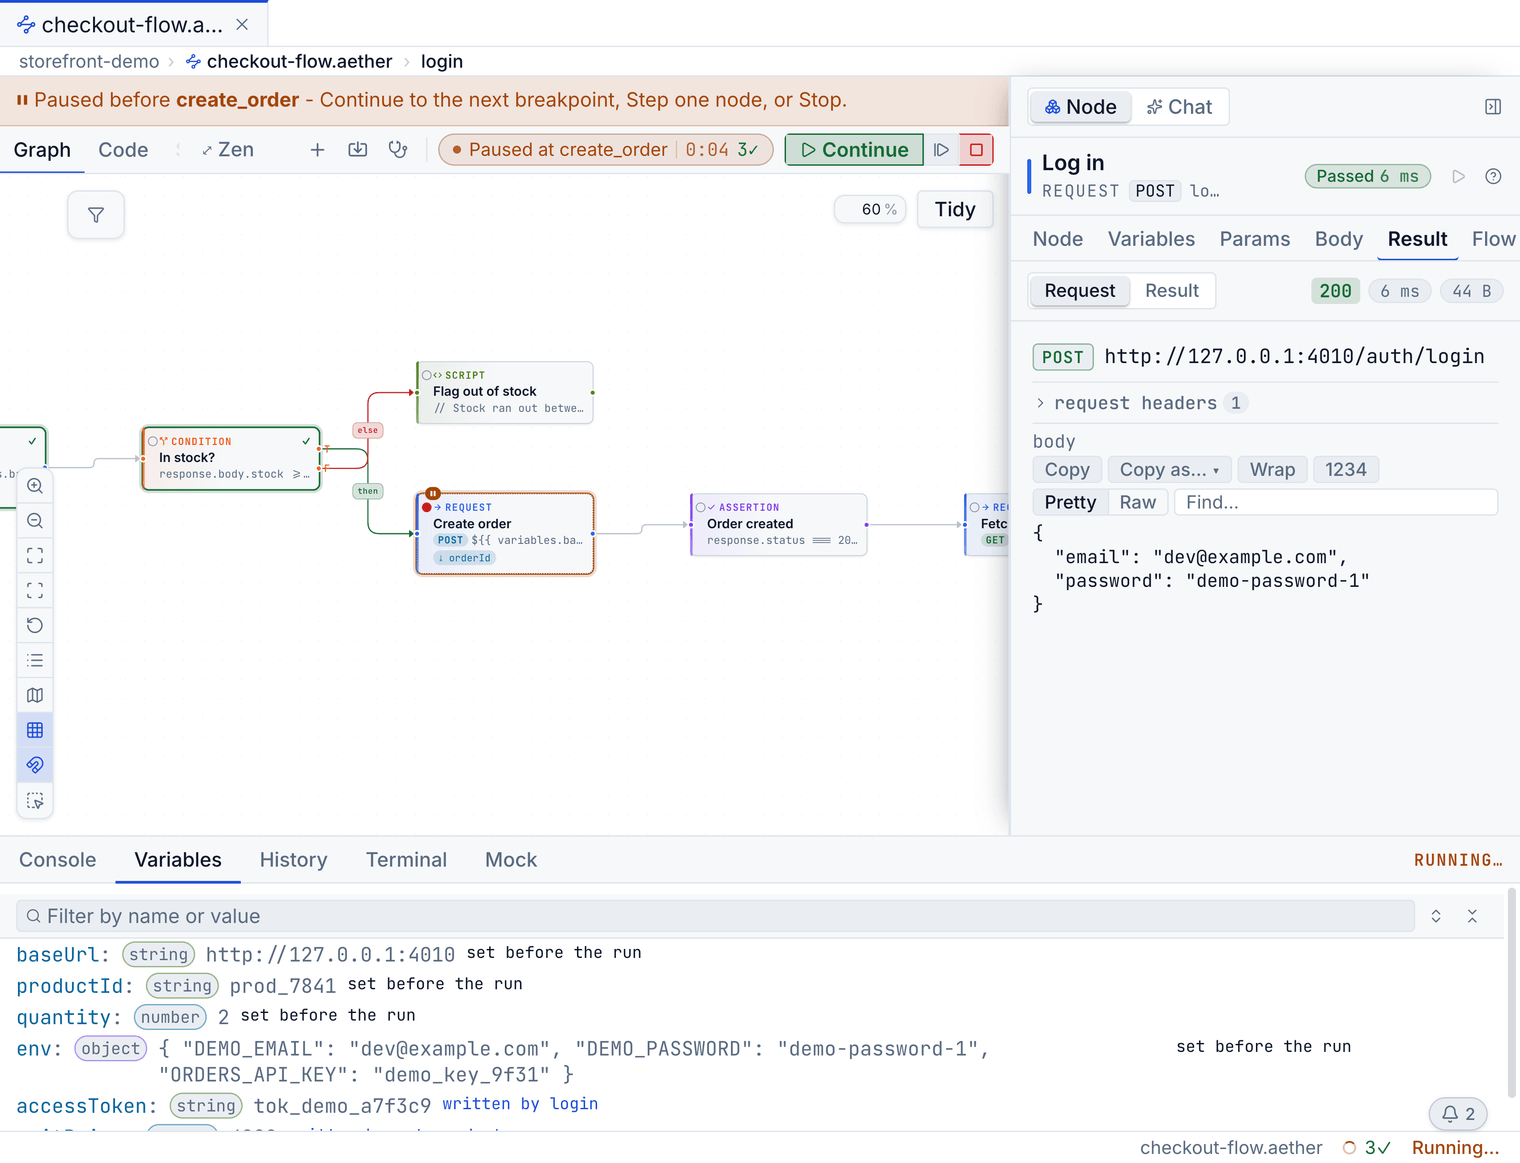
Step-through debugging
Pause mid-flow and see exactly what happens next.
Set a breakpoint and run: execution halts before that node fires, with the variables panel showing what the next call is about to spend. Breakpoints live in your editor, never in the .aether file.
- Node types
- 10
- Protocols in one engine
- 5
- Import formats
- 6
- CLI reporters
- 4
- MCP tools for agents
- 14
- Places the same engine runs
- 3
request · grpc · websocket · assertion · condition · loop · parallel · ai-action · subflow · script
REST, GraphQL, gRPC, WebSocket, Server-Sent Events
Postman, OpenAPI/Swagger, Insomnia, Bruno, HAR, curl
pretty, JSON, JUnit XML, GitHub annotations
read, run, lint, search, import, export, drift-detect, create and edit flows, replay runs, schema introspection
desktop app, headless CLI, MCP server: one binary's behaviour, not three ports
Side by side
What actually differs, and where the others win.
The differences that decide a switch. Everything else, the good tools all do well.
| Bandura | Postman | Bruno | Insomnia | |
|---|---|---|---|---|
| Plain-text, Git-native format | ✓ YAML in your repo | ✗ cloud workspace | ✓ .bru files | partial, via Git sync |
| Graph and code over one file | ✓ | Flows, no code view | ✗ code only | ✗ code only |
| Works offline, no account | ✓ | ✗ account + sync | ✓ | account gates most features |
| AI pricing model | BYO model, no credits or metering | credit economy | n/a | BYO LLM |
| Runs AI on a local model | ✓ Ollama / LM Studio, no key, nothing leaves the machine | ✗ vendor cloud | n/a | n/a |
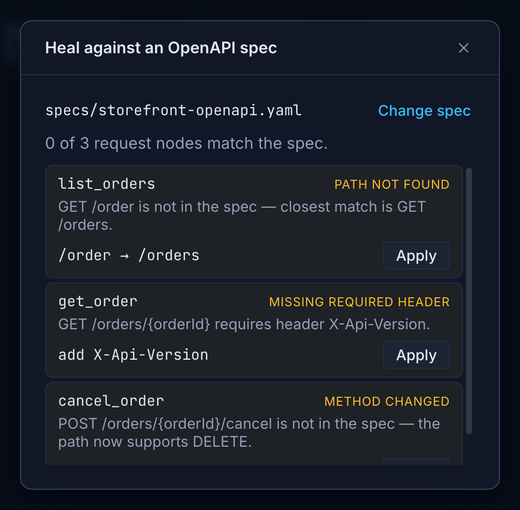
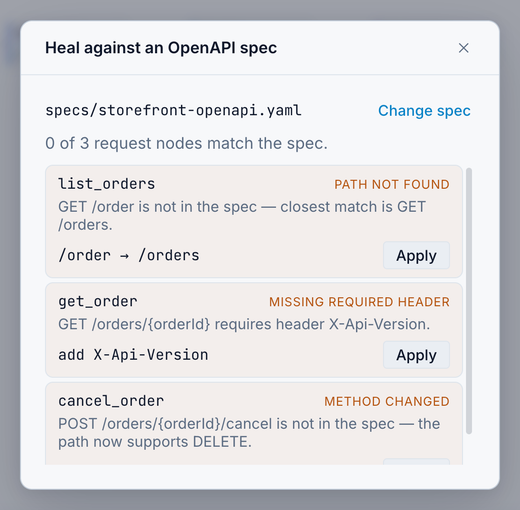
| Self-healing against OpenAPI drift | ✓ deterministic, offline | ✗ | ✗ | ✗ |
| What it costs | Free for personal and commercial use | $9–$49 per user/mo | $6–$11 per user/mo | $12–$45 per user/mo |
When Postman is still the right call: protocols we don't speak yet (MQTT, SOAP), a hosted team workspace, or a monitoring cloud. Full matrix and switching guide: Bandura vs Postman. Pricing from our July 2026 review; corrections to hello@bandura.dev.
Deeper comparisons: vs Postman · vs Insomnia · vs Bruno · Postman vs Bruno · the offline case
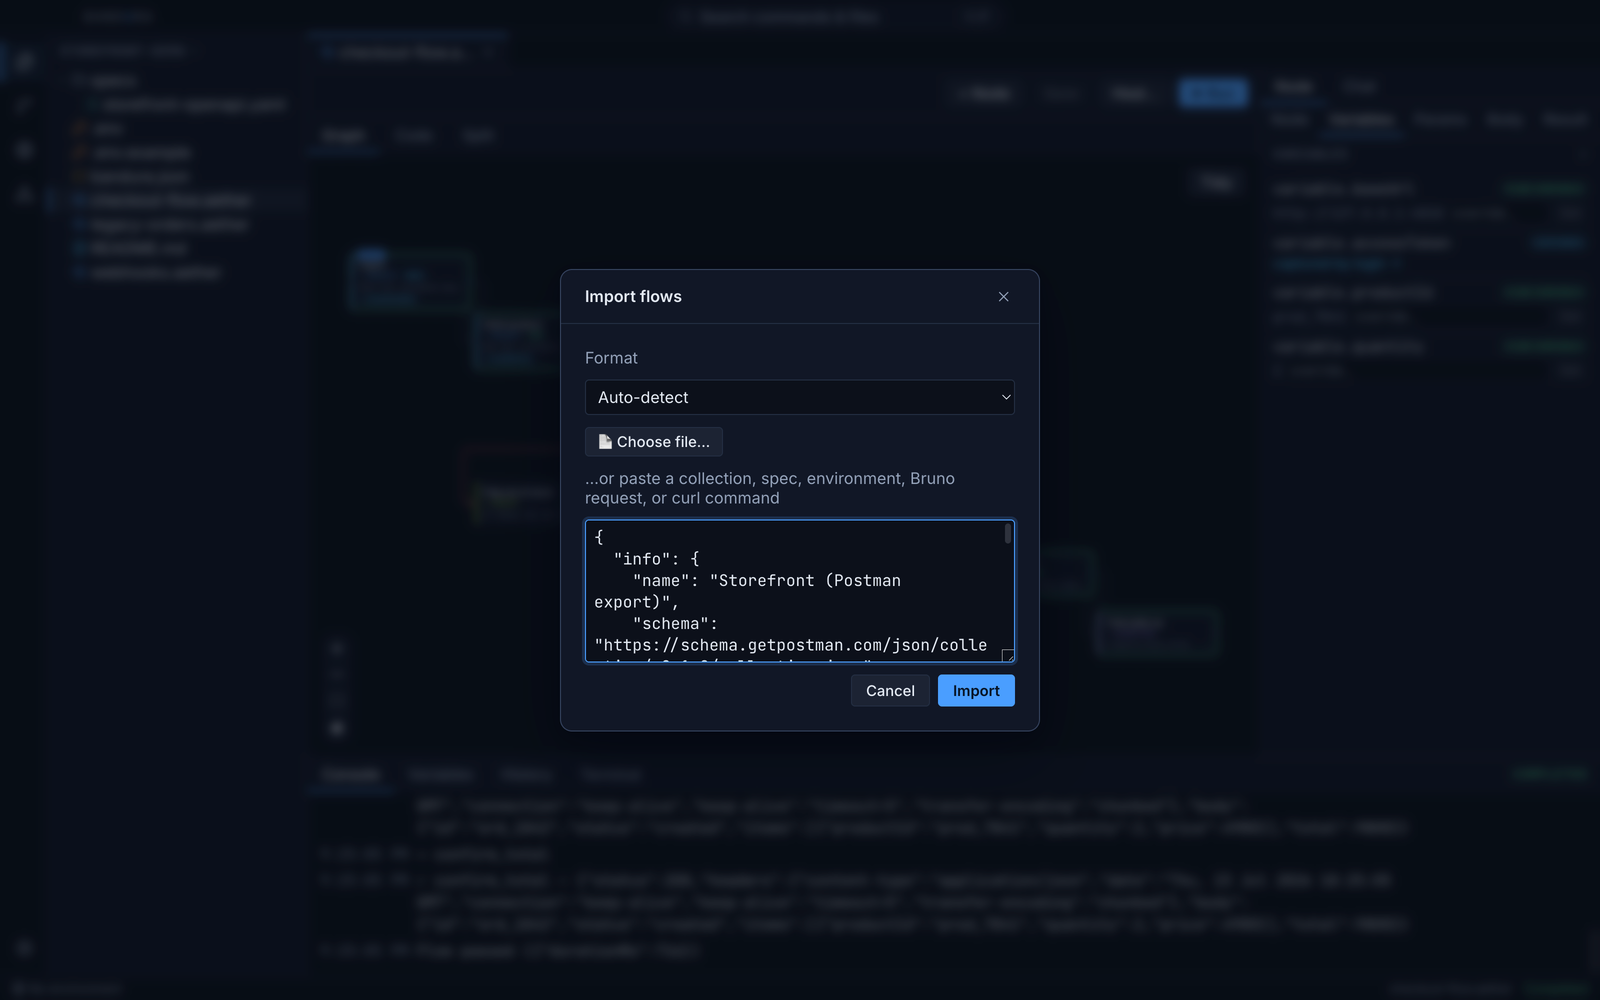
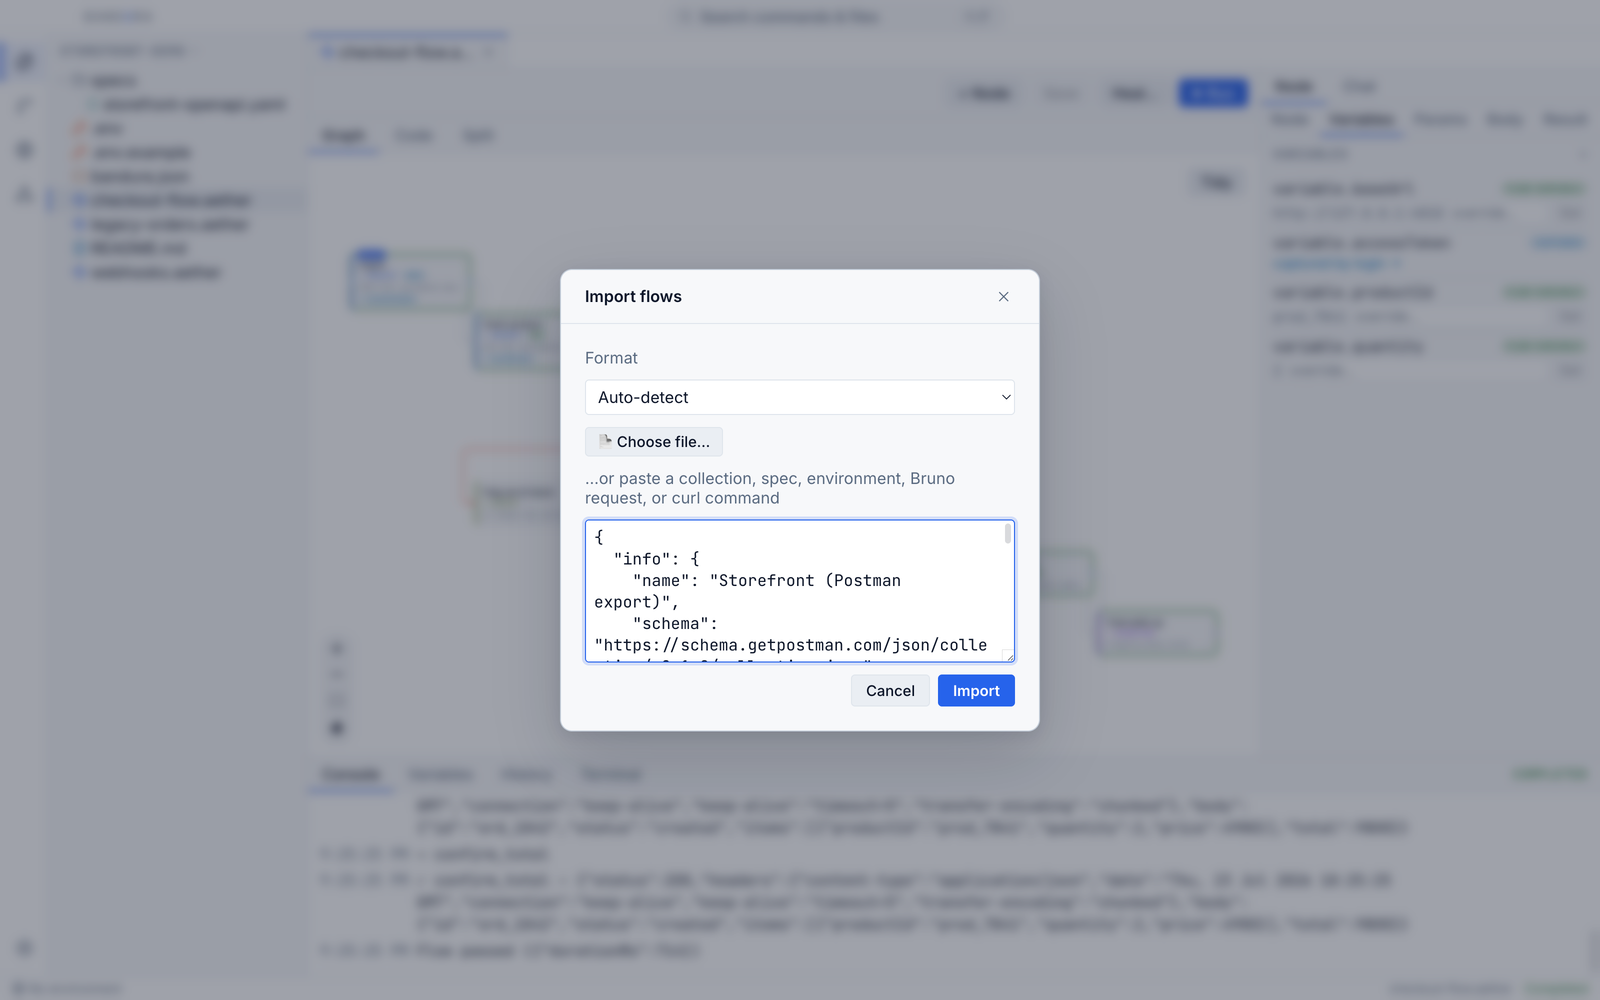
Import has a review step. You see the detected format, every flow it found with its node count and the calls it makes, the environment variables it picked up, checkboxes to take only the ones you want, and the folder they'll land in. Nothing touches disk until you press Import. (A HAR capture is a recording of one session, so it becomes a single chained flow, not one flow per request.)
Shipping in the open
What's shipped, what's next.
A release cadence is a fact you can check, so here it is: the last five builds, each dated from its release tag. Everything that isn't shipped says so.
- 18 September 2026 v1.0.0-rc.9 Bandura is free for personal and commercial use. Release notes
- 15 August 2026 v1.0.0-rc.8 Twenty things the editor could not do, most of them about reading a project rather than writing one: moving around it, seeing what a reference points at, and what git thinks you have changed. Release notes
- 9 August 2026 v1.0.0-rc.7 Correctness and speed, plus two changes to how your stored credentials are protected that are worth reading even if you skip the rest. Release notes
- 8 August 2026 v1.0.0-rc.6 A hardening release: security fixes, a production build that is compiled rather than shipped in readable form, and a considerably smaller install. Release notes
- 8 August 2026 v1.0.0-rc.5 The AI assistant became a harness rather than a text box: conversations that survive a restart, a context budget that summarizes instead of forgetting, local workspace search, and tools that let it check this build's schema instead of recalling one. Release notes
Shipped
- Desktop IDE: graph + code over
.aether, ten node types, step-through debugging - REST, GraphQL, gRPC, WebSocket, SSE on one engine; declared auth and an automatic cookie jar
- Import from Postman, OpenAPI/Swagger, Insomnia, Bruno, HAR and curl; self-healing against OpenAPI drift
- Headless CLI, MCP server for agents, AI on your own model including a local one
- The full list
Next
- Developer ID signing for macOS when funding permits; no date set
- Official GitHub Action on the Marketplace; not published yet
- More protocols (MQTT, SOAP), ordered by early-user demand
Later
- Scheduled monitors & remote execution
- Web app
- Team workspaces (hosted collaboration)
Free to use
Your API tests. No subscription.
Free for personal and commercial use. No trial, paid seat or subscription.
The complete desktop app, CLI and MCP server. No account or activation key required. Bring an API request, build a scenario, and keep the files in your repo.
If it helps you, support development on Patreon. Support is optional and unlocks no extra features.
Why "Bandura"
Named after an instrument you play with both hands.
The bandura is a Ukrainian string instrument: a lute's fretted neck and a zither's open
strings over one soundboard. Two ways of playing, every string tied to the same board:
the graph and the code are two hands, and the .aether file is the soundboard
underneath.
Questions, answered straight
FAQ
Free use, local files, imports and optional AI.
Getting it
Can I download Bandura today?
Yes, on macOS, Windows and Linux: an early-access release candidate is on the download page now. macOS builds are unsigned early access; the download page explains how to approve the first launch. The CLI, which runs the same engine, is already public on npm as @bandura/cli.
What platforms does it run on?
macOS (Apple Silicon and Intel), Windows, and Linux (AppImage and .deb), each built natively. macOS, Windows and Linux are downloadable today. The Windows build is unsigned until a certificate lands, so expect a one-time SmartScreen warning there; SmartScreen is a Windows thing, so Linux installs run without one. macOS builds are not Developer ID-signed or notarized. First launch requires approval in System Settings → Privacy & Security.
Is Bandura open source?
Not today, but there is no lock-in by design. .aether is documented plain YAML, readable by any tool. Your tests live in your Git history, never in our database.
What happens to my tests if you stop building Bandura?
They keep working, and that is a design constraint rather than a promise. Your flows are plain YAML in your own repository, in a format documented in full, so they are readable and editable with no Bandura installed at all. The runner is a published npm package you already hold a copy of. No activation server controls whether you can run the application. Nothing you own routes through us, which means there is no version of us disappearing that takes your work with it.
Free use and support
Is Bandura free?
Yes. The complete application is free for personal and commercial use. No trial, paid seat, activation key or subscription is required.
How can I support Bandura?
You can contribute through Patreon. Support is optional and unlocks no extra application features.
Why try Bandura if I already use an API client?
Try it on one scenario with dependent requests: login, capture a token, create an object and verify it. The graph shows the dependency chain and the failing step; the same files can run in CI. You do not need to migrate your whole workspace.
An older build asks me to buy a licence. Do I need one?
No. The free-use permission also covers earlier official releases. Older builds may still show the retired reminder; no payment is required. See the download page for the latest available build.
How it works
What is an .aether file?
One flow, as plain YAML with embedded JavaScript: an ordered, branching set of nodes. Routing lives on each node, so there is no separate graph state to drift out of sync.
Isn't this just a wrapper around curl?
No. Nothing shells out. Requests run inside a sandboxed execution engine with its own scheduler, so a flow can branch on a response, loop over a dataset, fan out in parallel, call another flow, hold a WebSocket open, collect an SSE stream, and carry captured variables between nodes with per-run isolation. The same engine binary runs in the desktop app, the CLI, and the MCP server, which is why a run in CI behaves identically to the one you just watched on the canvas.
Does it support GraphQL, gRPC, WebSocket, or SSE?
All four are shipped. GraphQL and SSE ride the request node as optional blocks; gRPC (unary and server-streaming, via .proto or reflection) and WebSocket are their own node types. All run identically in the desktop app, the CLI, and the MCP server.
Can I run one flow against many rows of test data?
Attach a CSV or JSON dataset and the flow runs once per row, that row in scope as `data`. Each row is an independent test case, and a captured value never leaks into the next.
What does a failed run actually tell me?
Which node failed and why: an assertion's expected value against the actual one, the HTTP status, or the unwrapped transport cause, so a DNS or TLS fault reads as itself rather than as a generic `fetch failed`. Each one carries a jump to the matching log line. Repeated identical notifications collapse into one row with a count instead of stacking up.
How do I run API tests in CI?
The bandura CLI runs any flow or glob headlessly and exits non-zero on failure. Reporters: pretty, JSON, JUnit XML, and GitHub annotations.
Migrating, privacy and AI
Is Bandura a Postman alternative?
Yes, and it is the most common migration. No account, no cloud sync: your tests are plain-text .aether files in your own Git repository, and one-click Postman Collection v2.1 import is shipped.
Can I import Postman collections, OpenAPI specs, or curl commands?
Yes, all shipped: Postman Collection v2.1, OpenAPI 3.0/3.1 and Swagger 2.0, pasted curl, Bruno, Insomnia v4, HAR captures, and Postman environment files.
Can I see what an import will do before it writes files?
Yes. Import shows a review step first: the detected format, each flow it found with its node count and the requests it makes, the environment variables it picked up, checkboxes to import only the flows you want, an editable destination folder, and a flat option. Nothing is written to disk until you press Import.
Does Bandura work offline?
Fully. Editing, running, importing, drift detection, the CLI: all local, no account, no network. Two things call out, and nothing else does. AI generation and chat reach whichever provider you configure, and if that is a local Ollama or LM Studio, nothing leaves your machine at all. Separately, the app asks our public releases list once a day whether a newer version exists so it can tell you: it sends no identifier, it fails silently when you are offline, and one switch in Settings turns it off. Nothing is fetched or installed unless you press the button that does it.
Where does Bandura store my settings, API keys, and licence key?
Settings live in a hand-editable `settings.json` next to the app's data, following VS Code's model, with a typed schema: theme, a custom hex accent, font, density, line height, per-token colour overrides, and the AI provider block. Comments are allowed, deleting a key restores its default, an invalid value degrades to the default with a warning instead of breaking the app, and writes are atomic so an interrupted save can't corrupt it. API keys are deliberately not in that file. They stay in the OS-encrypted secret store. The licence key is kept separately too, so hand-editing settings can never invalidate it.
What does the AI cost?
Whatever your own provider costs you. No markup, no credits, no metering. Run it on a local model and it costs nothing. Most of the intelligence needs no key at all either: import, drift detection, and self-healing are deterministic and offline.
Can I use a local LLM, Ollama, or an OpenAI-compatible endpoint?
Yes. There are three providers: Anthropic and Google Gemini natively, and OpenAI-compatible, meaning any /chat/completions endpoint, which covers OpenAI, Groq, OpenRouter, Together, Ollama, and LM Studio. Point the base URL at http://localhost:11434/v1 and a local model powers chat, the agentic tool loop, flow generation, and ai-action nodes with no API key at all and no traffic leaving your machine. A Test connection button confirms it before you rely on it, and the CLI and MCP server read the same provider, base URL, and model from the environment.
Can I use Bandura's AI if my company forbids sending API payloads to a third party?
That is what the local-model path is for. With the provider pointed at an Ollama or LM Studio endpoint on your machine, no prompt, request payload, or response body leaves it, and the deterministic half of the intelligence (import, drift detection, self-healing, mock generation) never calls a model at all.
v1.0.0-rc.9 out now. Early access. No date set for 1.0.0 final.
Run it against your own API tonight.
Download v1.0.0-rc.9 and run your first flow tonight.
Want the v1.0.0 final release link? Leave an address and it arrives when the release is ready. Founding users get credited by name in the release notes, if they want to be. One or two emails, nothing else.
Download for macOS or Windows or Linux
No account, no telemetry. Two destinations on the app's own behalf, your AI provider and GitHub, both listed The roadmap marks what has shipped and what hasn't